Visualization
MMDetection3D provides a Det3DLocalVisualizer to visualize and store the state of the model during training and testing, as well as results, with the following features.
Support the basic drawing interface for multi-modality data and multi-task.
Support multiple backends such as local, TensorBoard, to write training status such as
loss,lr, or performance evaluation metrics and to a specified single or multiple backends.Support ground truth visualization on multimodal data, and cross-modal visualization of 3D detection results.
Basic Drawing Interface
Inherited from DetLocalVisualizer, Det3DLocalVisualizer provides an interface for drawing common objects on 2D images, such as drawing detection boxes, points, text, lines, circles, polygons, and binary masks. More details about 2D drawing can refer to the visualization documentation in MMDetection. Here we introduce the 3D drawing interface:
Drawing point cloud on the image
We support drawing point cloud on the image by using draw_points_on_image.
import mmcv
import numpy as np
from mmengine import load

from mmdet3d.visualization import Det3DLocalVisualizer

info_file = load('demo/data/kitti/000008.pkl')
points = np.fromfile('demo/data/kitti/000008.bin', dtype=np.float32)
points = points.reshape(-1, 4)[:, :3]
lidar2img = np.array(info_file['data_list'][0]['images']['CAM2']['lidar2img'], dtype=np.float32)

visualizer = Det3DLocalVisualizer()
img = mmcv.imread('demo/data/kitti/000008.png')
img = mmcv.imconvert(img, 'bgr', 'rgb')
visualizer.set_image(img)
visualizer.draw_points_on_image(points, lidar2img)
visualizer.show()

Drawing 3D Boxes on Point Cloud
We support drawing 3D boxes on point cloud by using draw_bboxes_3d.
import torch
import numpy as np

from mmdet3d.visualization import Det3DLocalVisualizer
from mmdet3d.structures import LiDARInstance3DBoxes

points = np.fromfile('demo/data/kitti/000008.bin', dtype=np.float32)
points = points.reshape(-1, 4)
visualizer = Det3DLocalVisualizer()
# set point cloud in visualizer
visualizer.set_points(points)
bboxes_3d = LiDARInstance3DBoxes(
    torch.tensor([[8.7314, -1.8559, -1.5997, 4.2000, 3.4800, 1.8900,
                   -1.5808]]))
# Draw 3D bboxes
visualizer.draw_bboxes_3d(bboxes_3d)
visualizer.show()

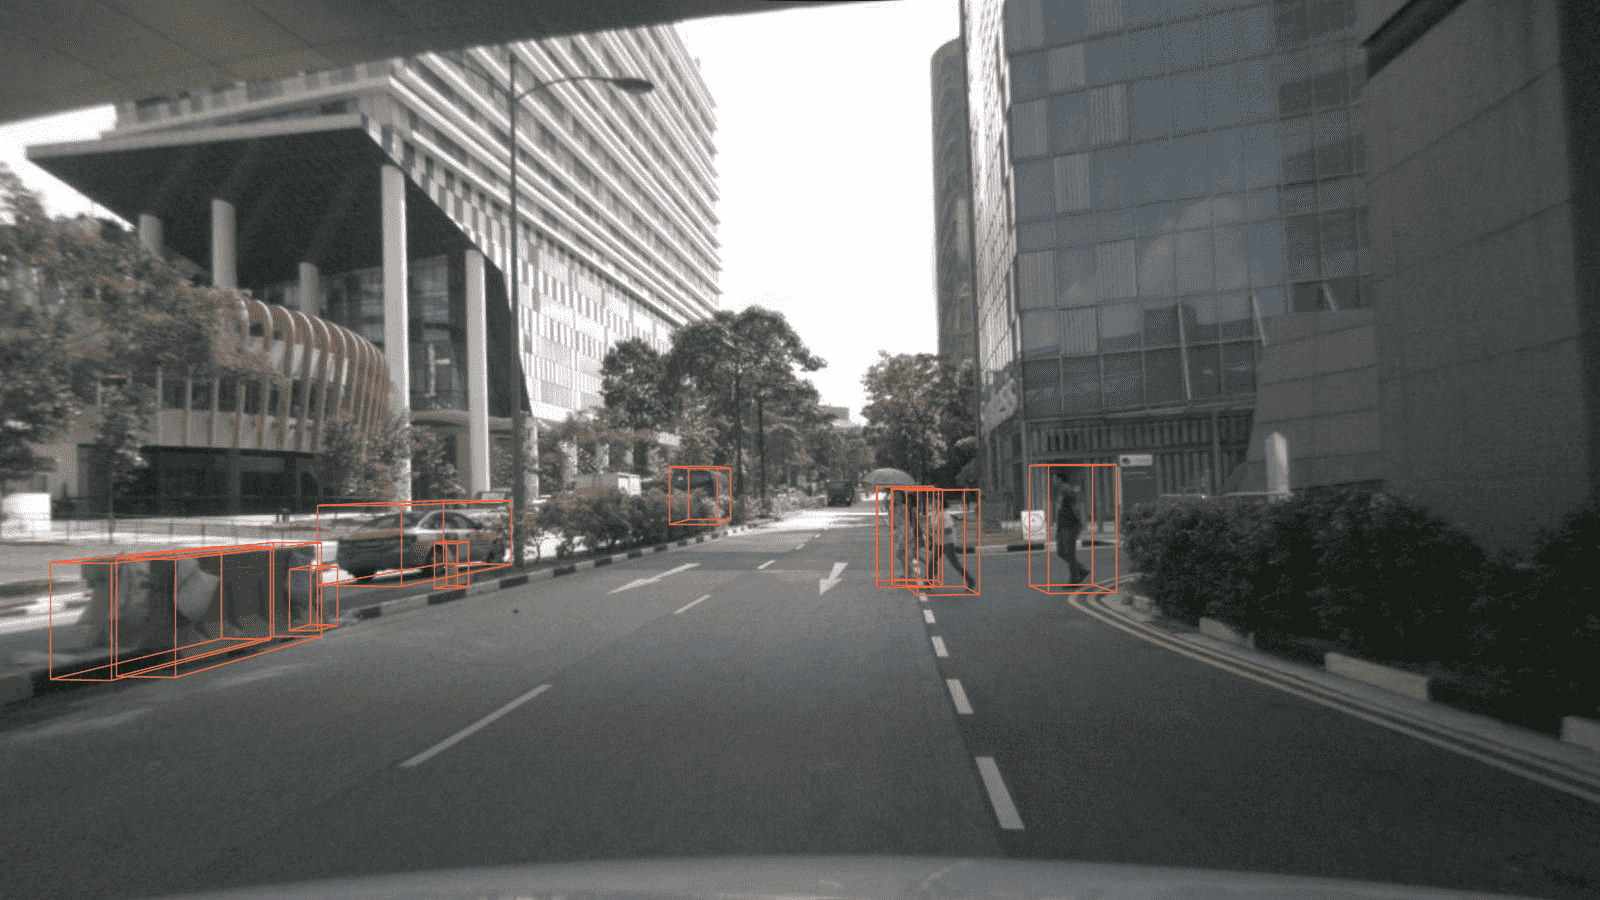
Drawing Projected 3D Boxes on Image
We support drawing projected 3D boxes on image by using draw_proj_bboxes_3d.
import mmcv
import numpy as np
from mmengine import load

from mmdet3d.visualization import Det3DLocalVisualizer
from mmdet3d.structures import CameraInstance3DBoxes

info_file = load('demo/data/kitti/000008.pkl')
cam2img = np.array(info_file['data_list'][0]['images']['CAM2']['cam2img'], dtype=np.float32)
bboxes_3d = []
for instance in info_file['data_list'][0]['instances']:
    bboxes_3d.append(instance['bbox_3d'])
gt_bboxes_3d = np.array(bboxes_3d, dtype=np.float32)
gt_bboxes_3d = CameraInstance3DBoxes(gt_bboxes_3d)
input_meta = {'cam2img': cam2img}

visualizer = Det3DLocalVisualizer()

img = mmcv.imread('demo/data/kitti/000008.png')
img = mmcv.imconvert(img, 'bgr', 'rgb')
visualizer.set_image(img)
# project 3D bboxes to image
visualizer.draw_proj_bboxes_3d(gt_bboxes_3d, input_meta)
visualizer.show()
Drawing BEV Boxes
We support drawing BEV boxes by using draw_bev_bboxes.
import numpy as np
from mmengine import load

from mmdet3d.visualization import Det3DLocalVisualizer
from mmdet3d.structures import CameraInstance3DBoxes

info_file = load('demo/data/kitti/000008.pkl')
bboxes_3d = []
for instance in info_file['data_list'][0]['instances']:
    bboxes_3d.append(instance['bbox_3d'])
gt_bboxes_3d = np.array(bboxes_3d, dtype=np.float32)
gt_bboxes_3d = CameraInstance3DBoxes(gt_bboxes_3d)

visualizer = Det3DLocalVisualizer()
# set bev image in visualizer
visualizer.set_bev_image()
# draw bev bboxes
visualizer.draw_bev_bboxes(gt_bboxes_3d, edge_colors='orange')
visualizer.show()
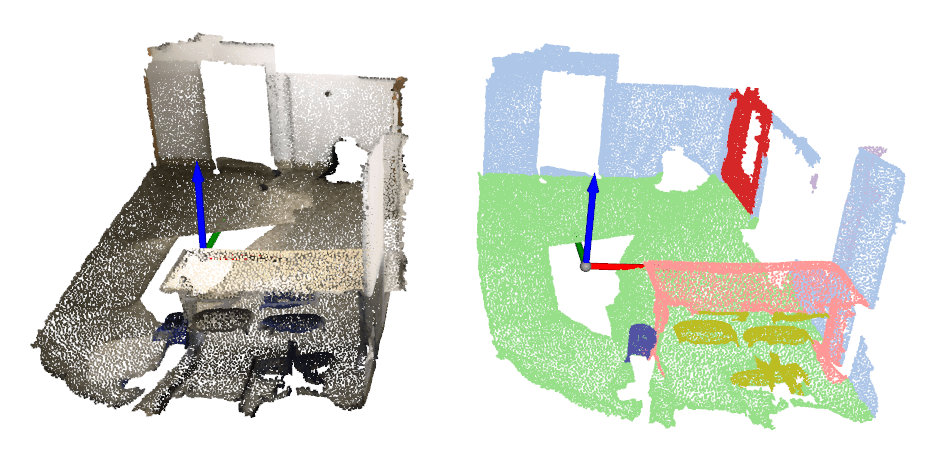
Drawing 3D Semantic Mask
We support draw segmentation mask via per-point colorization by using draw_seg_mask.
import numpy as np

from mmdet3d.visualization import Det3DLocalVisualizer

points = np.fromfile('demo/data/sunrgbd/000017.bin', dtype=np.float32)
points = points.reshape(-1, 3)
visualizer = Det3DLocalVisualizer()
mask = np.random.rand(points.shape[0], 3)
points_with_mask = np.concatenate((points, mask), axis=-1)
# Draw 3D points with mask
visualizer.set_points(points, pcd_mode=2, vis_mode='add')
visualizer.draw_seg_mask(points_with_mask)
visualizer.show()
Results
To see the prediction results of trained models, you can run the following command:
python tools/test.py ${CONFIG_FILE} ${CKPT_PATH} --show --show-dir ${SHOW_DIR}
After running this command, plotted results including input data and the output of networks visualized on the input will be saved in ${SHOW_DIR}.
After running this command, you will obtain the input data, the output of networks and ground-truth labels visualized on the input (e.g. ***_gt.png and ***_pred.png in multi-modality detection task and vision-based detection task) in ${SHOW_DIR}. When show is enabled, Open3D will be used to visualize the results online. If you are running test in remote server without GUI, the online visualization is not supported. You can download the results.pkl from the remote server, and visualize the prediction results offline in your local machine.
To visualize the results with Open3D backend offline, you can run the following command:
python tools/misc/visualize_results.py ${CONFIG_FILE} --result ${RESULTS_PATH} --show-dir ${SHOW_DIR}
This allows the inference and results generation to be done in remote server and the users can open them on their host with GUI.
Dataset
We also provide scripts to visualize the dataset without inference. You can use tools/misc/browse_dataset.py to show loaded data and ground-truth online and save them on the disk. Currently we support single-modality 3D detection and 3D segmentation on all the datasets, multi-modality 3D detection on KITTI and SUN RGB-D, as well as monocular 3D detection on nuScenes. To browse the KITTI dataset, you can run the following command:
python tools/misc/browse_dataset.py configs/_base_/datasets/kitti-3d-3class.py --task lidar_det --output-dir ${OUTPUT_DIR}
Notice: Once specifying --output-dir, the images of views specified by users will be saved when pressing _ESC_ in open3d window. If you want to zoom out/in the point clouds to inspect more details, you could specify --show-interval=0 in the command.
To verify the data consistency and the effect of data augmentation, you can also add --aug flag to visualize the data after data augmentation using the command as below:
python tools/misc/browse_dataset.py configs/_base_/datasets/kitti-3d-3class.py --task lidar_det --aug --output-dir ${OUTPUT_DIR}
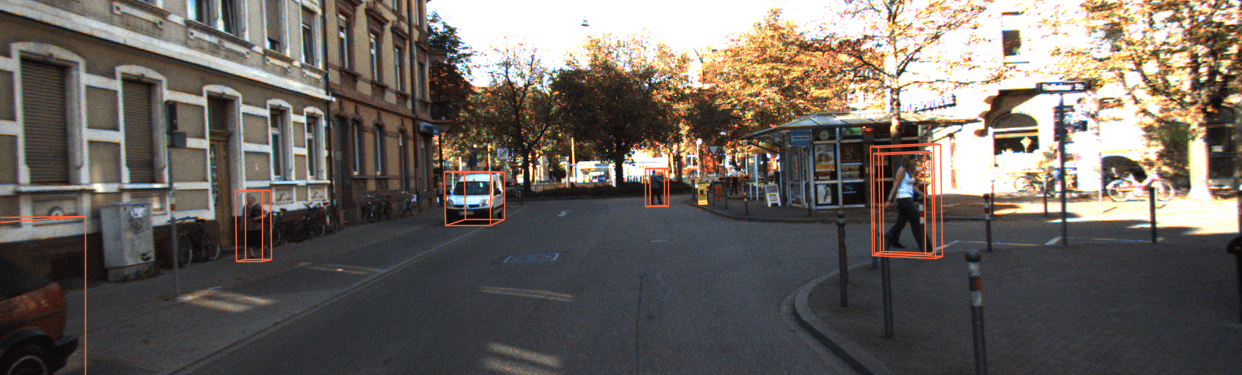
If you also want to show 2D images with 3D bounding boxes projected onto them, you need to find a config that supports multi-modality data loading, and then change the --task args to multi-modality_det. An example is showed below:
python tools/misc/browse_dataset.py configs/mvxnet/mvxnet_fpn_dv_second_secfpn_8xb2-80e_kitti-3d-3class.py --task multi-modality_det --output-dir ${OUTPUT_DIR}
You can simply browse different datasets using different configs, e.g. visualizing the ScanNet dataset in 3D semantic segmentation task:
python tools/misc/browse_dataset.py configs/_base_/datasets/scannet-seg.py --task lidar_seg --output-dir ${OUTPUT_DIR}
And browsing the nuScenes dataset in monocular 3D detection task:
python tools/misc/browse_dataset.py configs/_base_/datasets/nus-mono3d.py --task mono_det --output-dir ${OUTPUT_DIR}